- Ethereum price is now coming on its own and moving out of the bear clutch
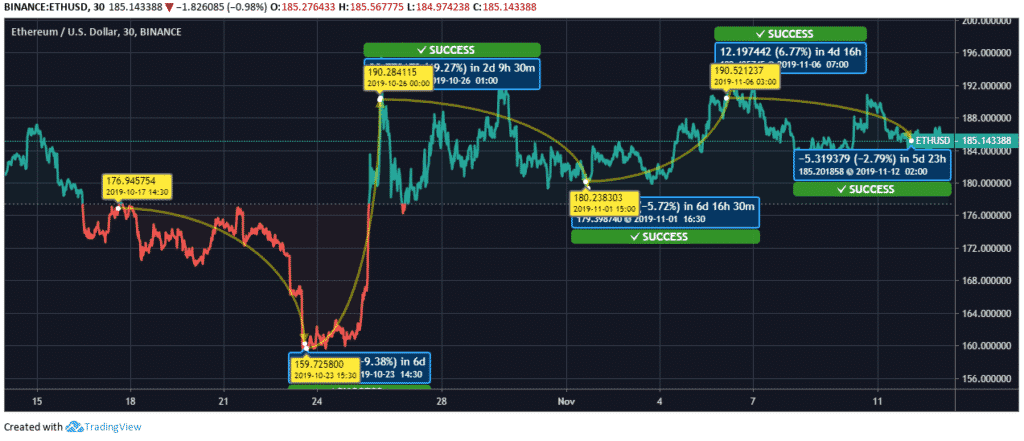
The past one-month gives some hope for the Ethereum community as the price has been able to pick up and move steadily above the baseline for the most part of the month. The one-month price chart of ETH shows the price fluctuating in the range between $159.73 – $190.52.
Ethereum Price Analysis
ETH price has managed to gain an uptrend for most of the past 30 days bringing relief to its huge community. The price was moving at $176.94 on October 17. The bears being active, the price of Ethereum went down to $159.72 on October 23. The price then started showing a positive trend and reached $190.2841 by 19.27% hike on October 26.
Ethereum price continued to fluctuate but managed to stay above the baseline and was at $180.2383 on November 01; the movement is 5.72%. The currency continued to show positive momentum, and the price went upwards at $190.5212 on November 06. It moved slightly down on November 12 at $185.2019 at 2.79% drop. The current day’s price of Ethereum is at $185.14.

The Market Cap of Ethereum came under severe pressure since the beginning of July. However, now the coin seems to be on the road to recovery. Analysts expect ETH to pick up from this and go for a stable bullish run from the first quarter of 2020. Short-term and day traders can continue trading but should be careful about the volatile nature of the crypto market.


