With recent DigiByte update on Android and iOS, followers are expressing their delight on social media already. We hope to see some good fluctuation and improved capitalization on the chart too. Followers adore the new updates and it might have increased the number of supplies and volume too.
Price Analysis of DigiByte on 25th July 2019
The value of DGB is seen trading at $0.01011 at 08:27 UTC time on 25th July 2019, which is a constant value seen since yesterday. The other essentials factors in the chart are calculated as:
- Market Ranking: @56
- Return of Investment: 642.77%
- Total supply/Circulating Supply: 12,068,925,353 DGB/ 12,068,925,353 DGB
- 24 Hour Volume: 1,221,640 USD
- Market Cap Value: 133,463,605 USD
- 7 Day high/low: 0.012505 USD / 0.010267 USD
Comparison

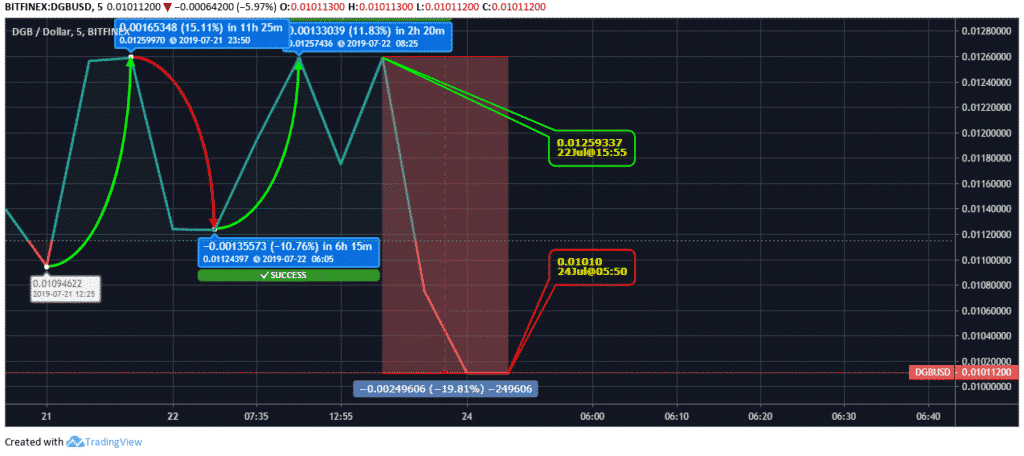
Considering the data statistics from last 5 days, the lower value was seen trading at 12:25 UTC time on 21st July trading at $0.01094. The value escalated from then by 15.11% on the same day at 23:50 UTC time with trading value of $0.0125. The value dropped by -10.76% on 22nd July at 06:05 UTC time trading at $0.0112.
The value in next few hours was increased by 11.83% at 08:25 UTC time trading at $0.01257. The value after a sudden drop was seen fluctuating at the value at 15:55 UTC time on 22nd July. The value from then dropped by -19.81% on 24th July at 05:50 UTC time, with the trading value of $0.01010 and till now, fluctuating at the same valuation.
Prediction and Conclusion
With DGB trading in the bearish zone, this might be a good time for new traders to jump in the marathon by buying new DGB coins. However, you might want to consider the resistance support level calculated as:
R3: 0.011588
R2: 0.011219
R1: 0.011006
Pivot Point: 0.010637
S1: 0.010424
S2: 0.010055
S3: 0.009842
By end of 2019 approaching, traders might see the upside touchdown value of $0.02.


