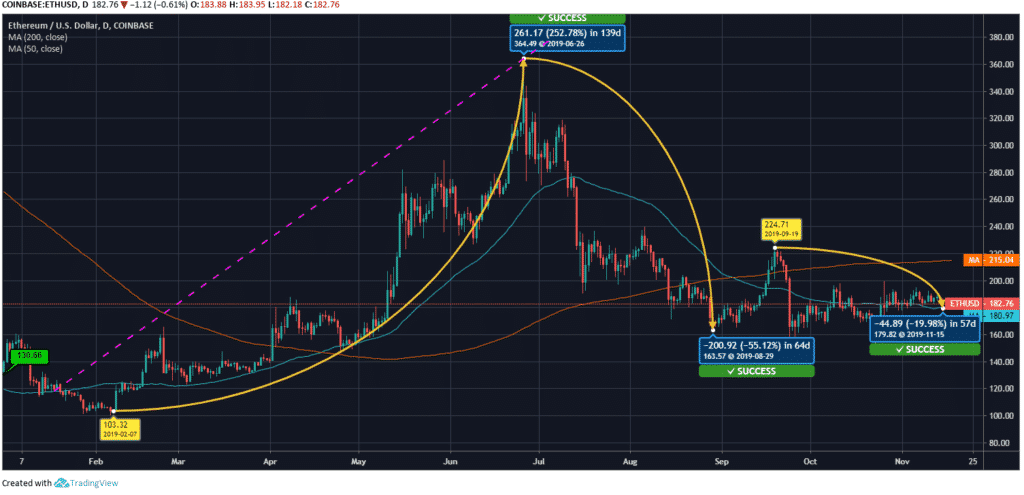
Ethereum (ETH), one of the top-ranked coins, has shown huge price fluctuations this year to date. It started the year at 130.66 USD, and now with an almost 40% increment, it is currently trading at 182.76 USD. The price trend of ETH coin over these 11 and half months can be divided into three major price shifts.
Ethereum Price Analysis
Ethereum’s first swing happened between February 07 & July 27, and in this period, ETH price gained 252.78% and reached the highest of the year at 364.49 USD. It was followed by a loss of 55.12% that cost it 200 USD and pushed the Ethereum price to 163.57 USD by August 29. The last major swing of the year happened between September 19 & November 15, and in these 57 days, the price of ETH coin moved from 224.71 USD to 179.82 USD.

The market cap of Ethereum also has seen a huge increment over these eleven months. The market cap at the starting of the year was 14.665 billion USD, and now it has scaled to as high as 20.011 billion USD.
ETH coin’s last 200 days moving average is at 215.04 USD and its 50 days average is 180.97 USD. The current value roams around 182.76 USD, and it is 0.98% more and 15.015% less than the 50 days and 200 days moving average, respectively. Ethereum’s next resistance may be found at 188.093 USD.
Resistance and Support Levels
R1- $188.0933333, R2- $191.0666667, R3- $ 193.9433333
S1- $182.2433333, S2- $179.3666667, S3- $176.3933333


